
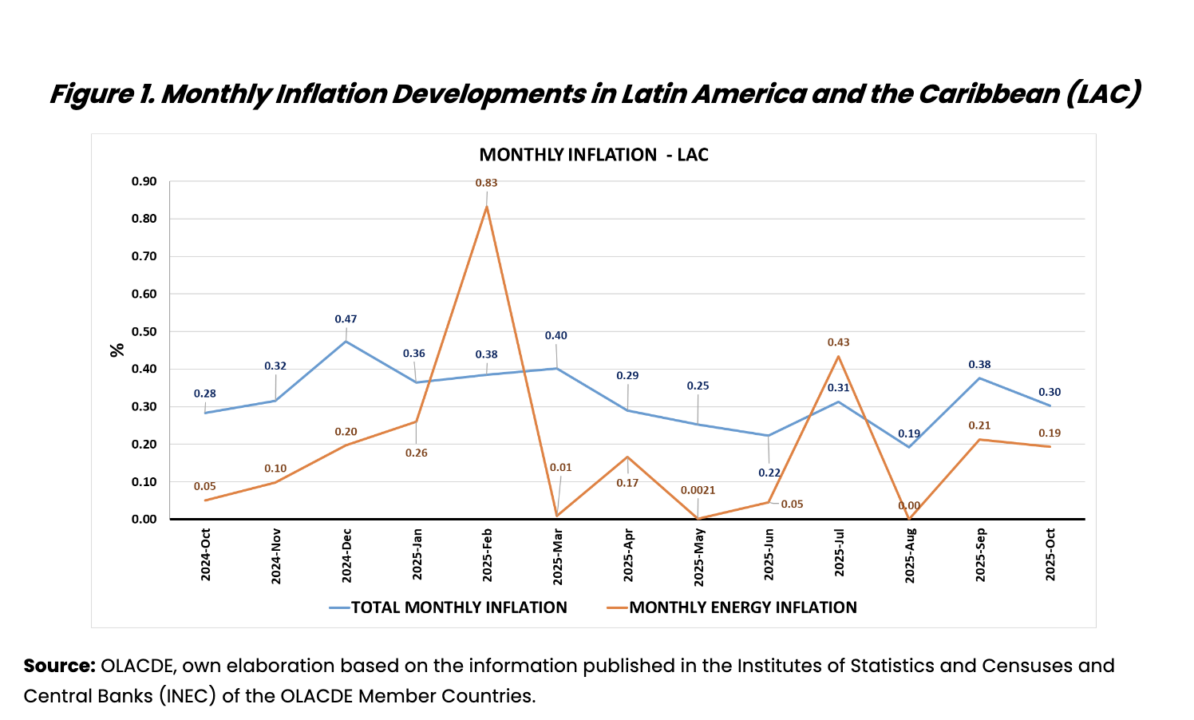
Monthly energy inflation in LAC between September and October 2025 recorded a decline, decreasing from 0.21% in September to 0.19% in October. This represents a 9.5% reduction compared to the previous month, mainly because, of the 20 countries analyzed, 12 showed a decline in the indicator, as several of them implemented tariff adjustments to electricity prices and fossil fuels.
In general terms, when analyzing the period from October 2024 to October 2025, energy inflation shows very pronounced fluctuations, reflecting the volatility of energy basket prices. Following the indicator’s peak in February 2025, an irregular pattern is observed, with alternating periods of increases and decreases, confirming its sensitivity to external factors (international prices, exchange rates) and domestic policies (subsidies, tariffs).
Total monthly inflation showed a more pronounced decline, falling from 0.38% in September to 0.30% in October 2025. This indicates that the decrease was driven mainly by components other than energy, such as food, goods, and services, which carry greater weight in the index. See Figure 1. It should be noted that total inflation shows a more stable trend with moderate variations, while energy inflation exhibits greater volatility and sensitivity, with sharp changes ranging from 0% to as high as 0.83% over the period analyzed.
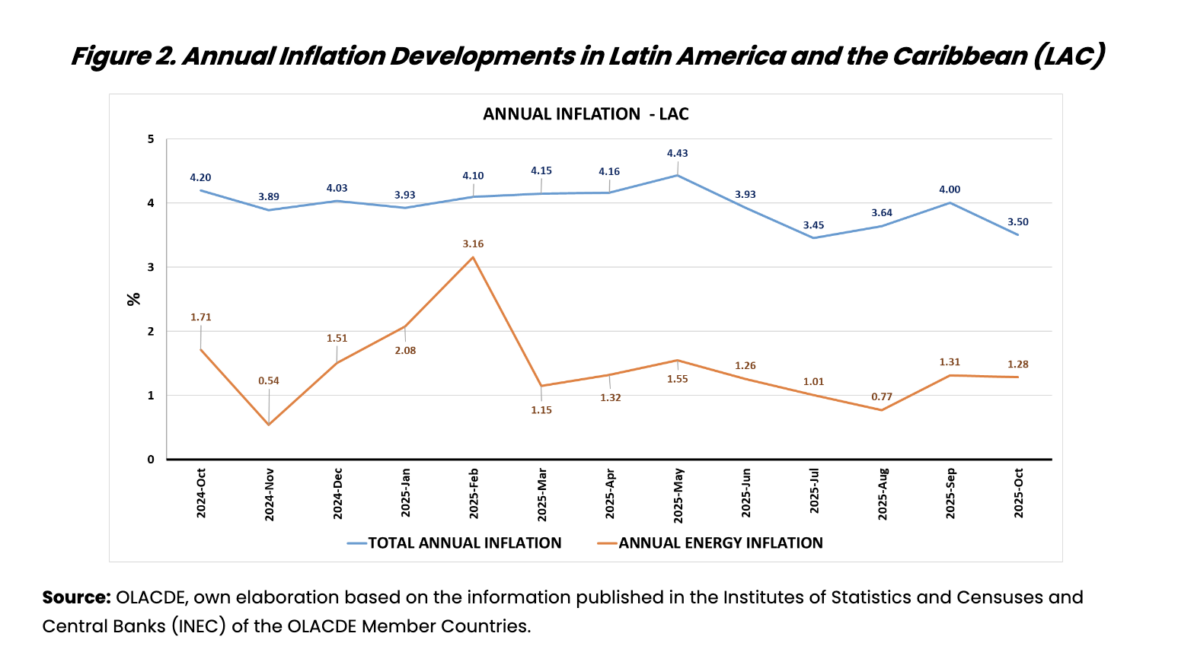
Annual energy inflation in October 2025 stood at 1.28%, registering a decrease compared to the previous month and displaying a variable pattern of increases and decreases. These fluctuations are mainly related to the variability of both domestic and international prices affecting the energy basket. Regarding total annual inflation, in October 2025 it showed a downward trend similar to that of annual energy inflation, standing at 3.5% and exhibiting a more stable pattern than annual energy inflation. See Figure 2.
Year-on-year energy inflation in OECD countries remained stable at 4.22% in October 2025, while in LAC it declined, indicating that the region exhibits greater volatility and a more pronounced decrease, whereas the OECD maintains higher and more stable levels. Regarding energy inflation in the OECD, 20 countries recorded a decrease, 14 an increase, and 3 remained stable. However, in several countries, the decline in energy inflation followed an increase in September 2025, reflecting a base effect stemming from a significant reduction in energy prices between August and September 2024.

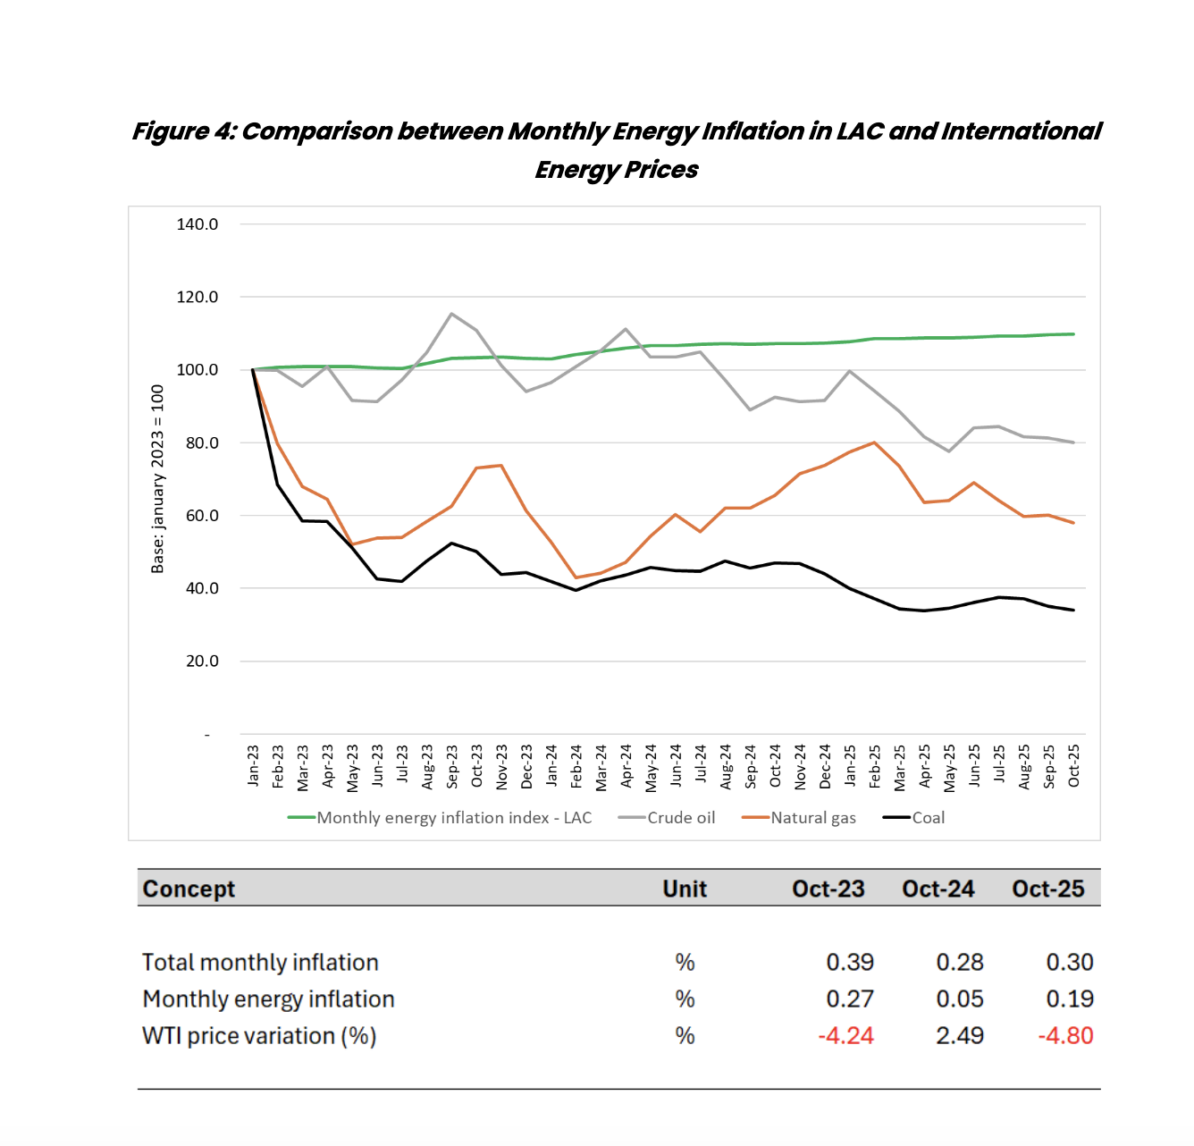
Figure 4 shows that the international oil price index records a slight decline of 1.6%, while the natural gas price index decreases by 3.45%. These trends are highly likely to explain the decline in monthly energy inflation in LAC, from 0.21% in September to 0.19% in October 2025. The attached table presents the monthly variation in the WTI price, which in October 2025 was negative at −4.80%, while in September 2025 it stood at −1.39%. This further deceleration would explain the evolution of the price indices.